User ManualPodWarden
Dashboard
Infrastructure overview with navigation cards, host status, and deployment counts

What you see
URL: /
The dashboard is the home page after login. It provides a high-level overview of your infrastructure through six navigation cards, each showing a count and brief description of the resource it represents.
Navigation cards
| Card | Count shows | Description |
|---|---|---|
| Hosts | Total registered hosts | Servers in your inventory, with status breakdown |
| K3s Clusters | Total clusters | Lightweight Kubernetes clusters managed by PodWarden |
| Deployments | Total assignments | stack templates bound to clusters |
| Deployments | Total deployments | Deployment history across all clusters |
| Provisioning | Total jobs | Server provisioning jobs with status breakdown |
| Settings | -- | System configuration, users, and integrations |
Clicking any card navigates to the corresponding page.
Status breakdowns
Host status
The Hosts card includes a breakdown of host states:
| Badge | Meaning |
|---|---|
| online | Host is reachable and reporting healthy |
| offline | Host is not responding to probes |
| provisioning | Host is being set up via Ansible |
| error | Last probe or provisioning attempt failed |
| unknown | Host has not been probed yet |
Provisioning status
The Provisioning card includes a breakdown of job states:
| Badge | Meaning |
|---|---|
| running | Job is currently executing |
| completed | Job finished successfully |
| failed | Job ended with an error |
| cancelled | Job was manually cancelled |
| queued | Job is waiting to start |
Version updates

When a new PodWarden version is available, you are notified in two places:
- Update banner — a dismissible bar at the top of every page showing the release name and a View changelog link
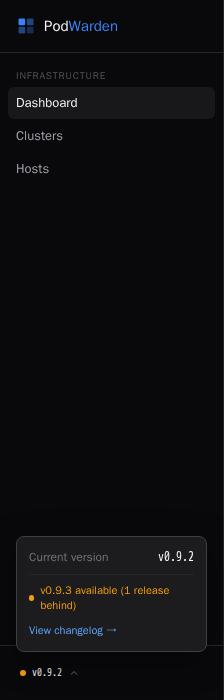
- Version panel — the bottom of the navigation sidebar shows the current version and how many releases behind you are
Both link to the changelog so you can review what changed before updating.
Available actions
The dashboard itself has no actions beyond navigation. Click any card to go to the detail page for that resource type.
Related docs
- Infrastructure Canvas -- Interactive topology visualization
- Hosts -- Server inventory and hardware details
- Clusters -- K3s cluster management
- Deployments -- Template-to-cluster bindings
- Provisioning -- Server provisioning jobs
- Settings -- System configuration